
If you want to build a business dashboard, showcase survey results, present marketing reports, or create a case study for a client, visualizing data is important. You need to work smart, and instead of displaying long tables of numbers, you can use Elementor charts to transform complex information into clear, well-organized visuals that are easy to comprehend.
What will make the difference is choosing the appropriate chart widget to improve user experience, highlight key insights, and make pages look more professional.
In this guide, we will explore the top 10 widgets for adding Elementor graphs and charts to your website in 2026. The article will cover the different chart types each widget supports, features, ease of use, and use cases.
If you want a versatile option, WPMozo Addons for Elementor includes pie and bar chart widgets in its free version, alongside dozens of other widgets that extend Elementor without custom code.
Why Use a Chart Widget Instead of Static Images
If you choose to add charts through an Elementor widget, it will visually appear clean, unlike uploading static image files. Most chart widgets generate charts using HTML5 Canvas or SVG. Canvas-based widgets redraw at the visitor’s device pixel ratio, so a chart stays crisp on a Retina display without you exporting a 2x version. SVG-based widgets scale to any size with no resolution ceiling at all. Either way, you skip generating and maintaining multiple image files per chart.
Another advantage of adding charts using the Elementor widget is that you can update values directly from the Elementor editor instead of recreating and reuploading an image in the Media Library.
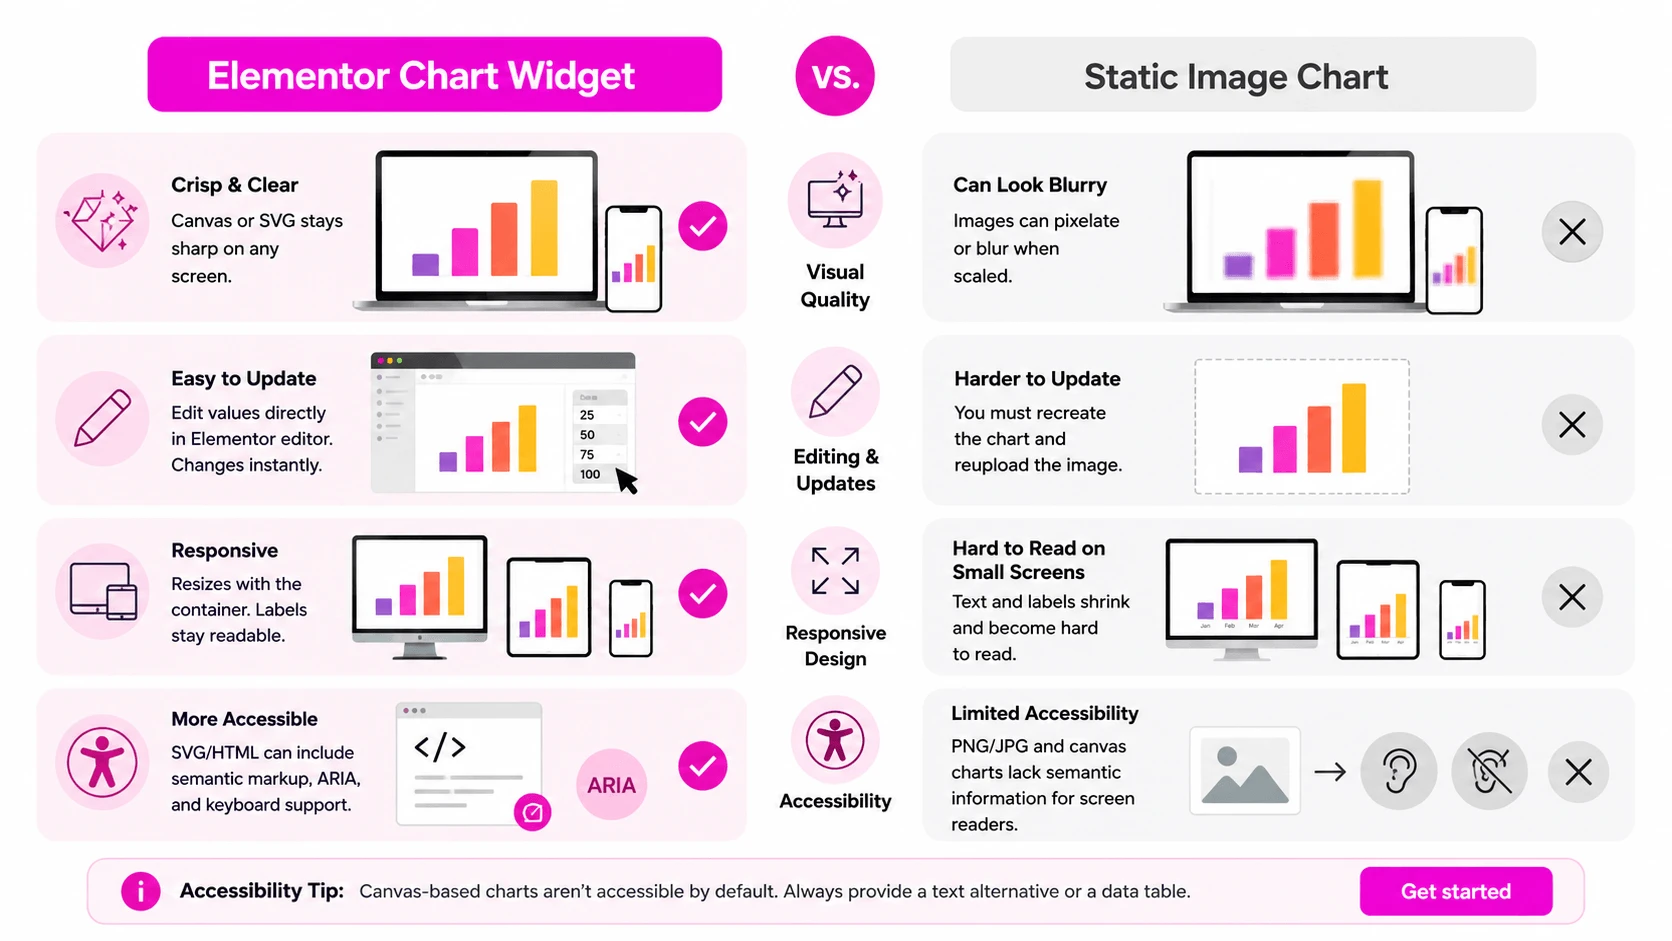
Most chart widgets also resize with their container, so labels and legends stay readable on desktops, tablets, and phones. A static image scales down as one flat unit, which means axis labels and legend text shrink past the point of legibility on narrow screens unless you produce a separate mobile version.
Accessibility depends on which rendering method the widget uses. SVG and HTML output can carry semantic markup, ARIA attributes, and keyboard focus, which a flat PNG or JPEG cannot. Canvas output cannot either, since the finished chart is a single bitmap as far as a screen reader is concerned. Most Elementor chart widgets render to canvas, so plan on adding a text alternative or an accompanying data table. The W3C Web Accessibility Initiative covers how to describe complex images and charts.
How We Evaluated These Widgets
We evaluated the different chart widgets using the same set of criteria. We looked at the range of chart types supported, including bar, line, pie, doughnut, radar, area, and mixed charts, and assessed styling options such as color, typography, legends, tooltips, animations, and responsive behavior across different screen sizes.
In addition, we checked whether the widget is available in a free or premium version, whether it supports dynamic data from WordPress or third-party sources, and its impact on page weight.
10 Best Elementor Chart Widgets
1. WPMozo Elementor Pie Chart Widget
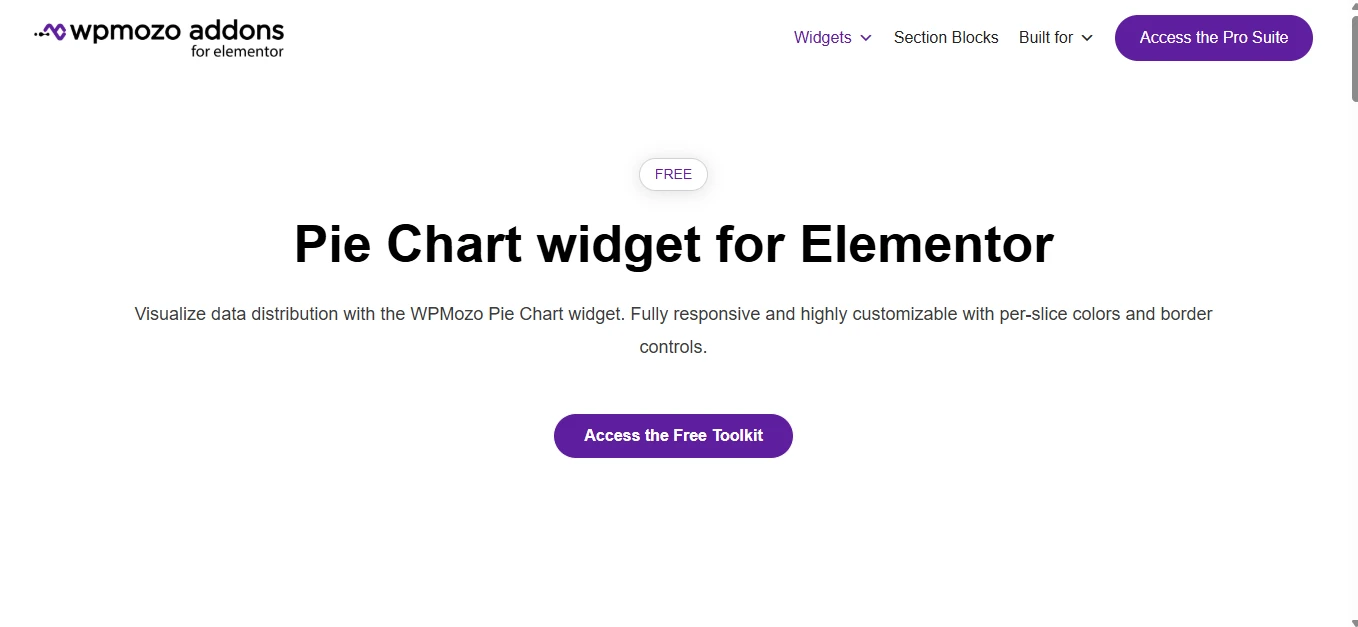
If you want to create pie charts without having to use external integrations or coding, the Elementor Pie Chart widget from WPMozo Addons builds them inside the Elementor editor.
The widget gives you control over every slice, so you can assign individual colors for better visual distinction. You can also customize the chart borders, which lets you match your site’s branding or create dark-themed dashboards. Since the charts are fully responsive, they maintain their appearance across desktops, tablets, and smartphones without additional adjustments.
It also has a demo that showcases practical applications such as budget breakdowns, website traffic sources, customer survey results, and dark UI analytics dashboards.
- Chart types supported: Pie Chart
- Standout controls: Per-slice color controls, border customization, responsive design.
- Pricing tier: Free (included in the free version of WPMozo Addons).
- Best for: Businesses and marketers looking for static pie charts with minimal setup.
2. WPMozo Elementor Bar Chart Widget
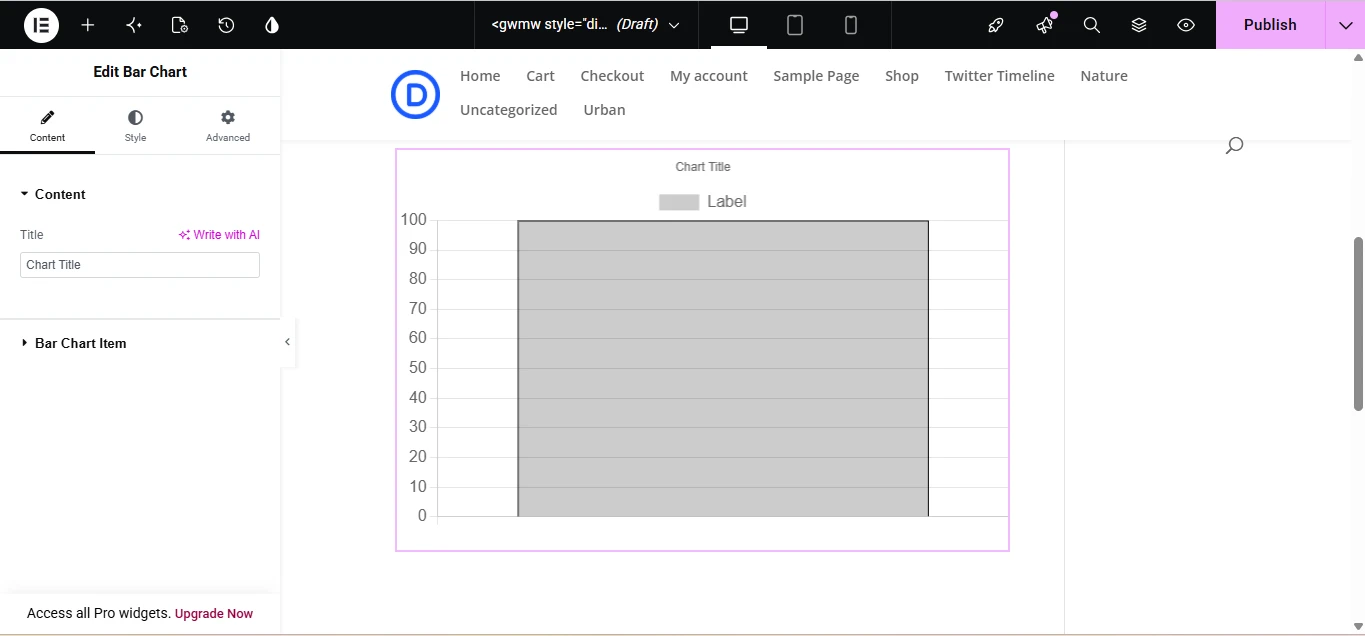
The WPMozo Bar Chart widget for Elementor is ideal for presenting comparisons that are easier to understand in a vertical format. It works for monthly sales, survey statistics, website analytics, etc.
This bar chart widget stands out because you can style every bar with custom colors to highlight important values or distinguish between categories.
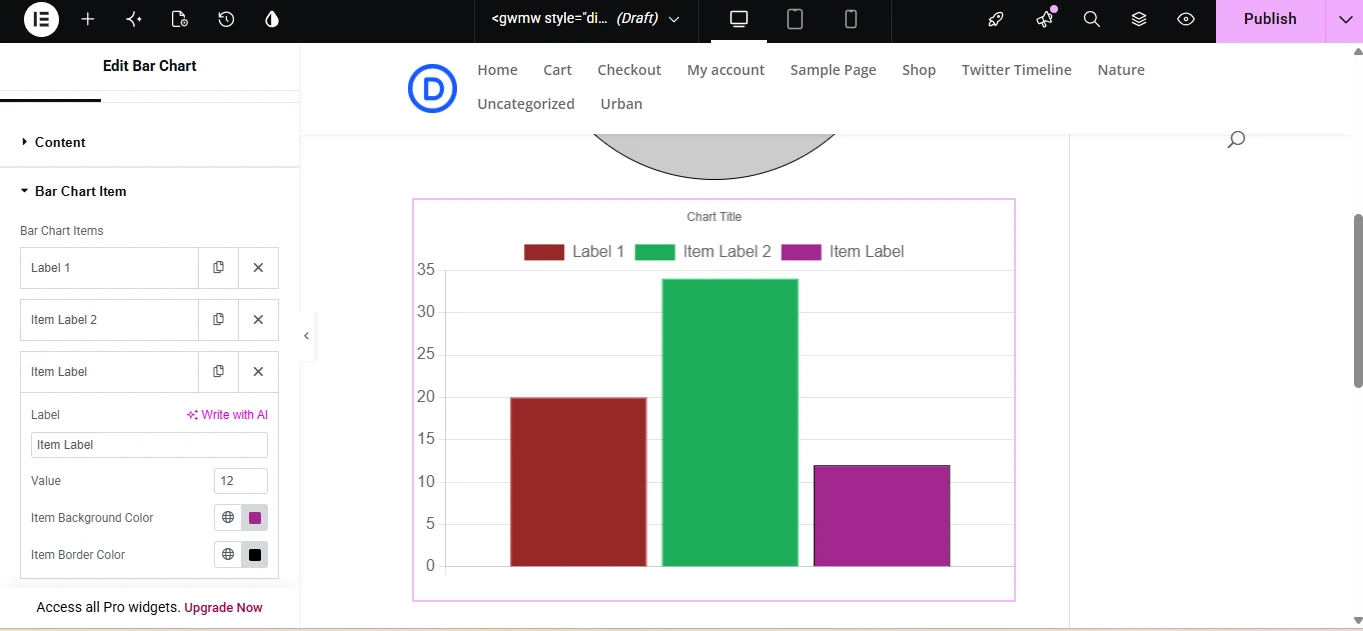
It features a demo that shows a two-dataset comparison for mobile versus desktop and how you can illustrate multiple datasets in the same chart. You can use it to create bar graphs for business reports, educational content, performance dashboards, etc.
- Chart types supported: Vertical Bar Chart
- Standout controls: Individual bar styling, two-dataset comparison, dark mode styling, responsive layout.
- Pricing tier: Free.
- Best for: Website owners who need comparison charts without premium upgrades.
3. Graphina (Iqonic Design)
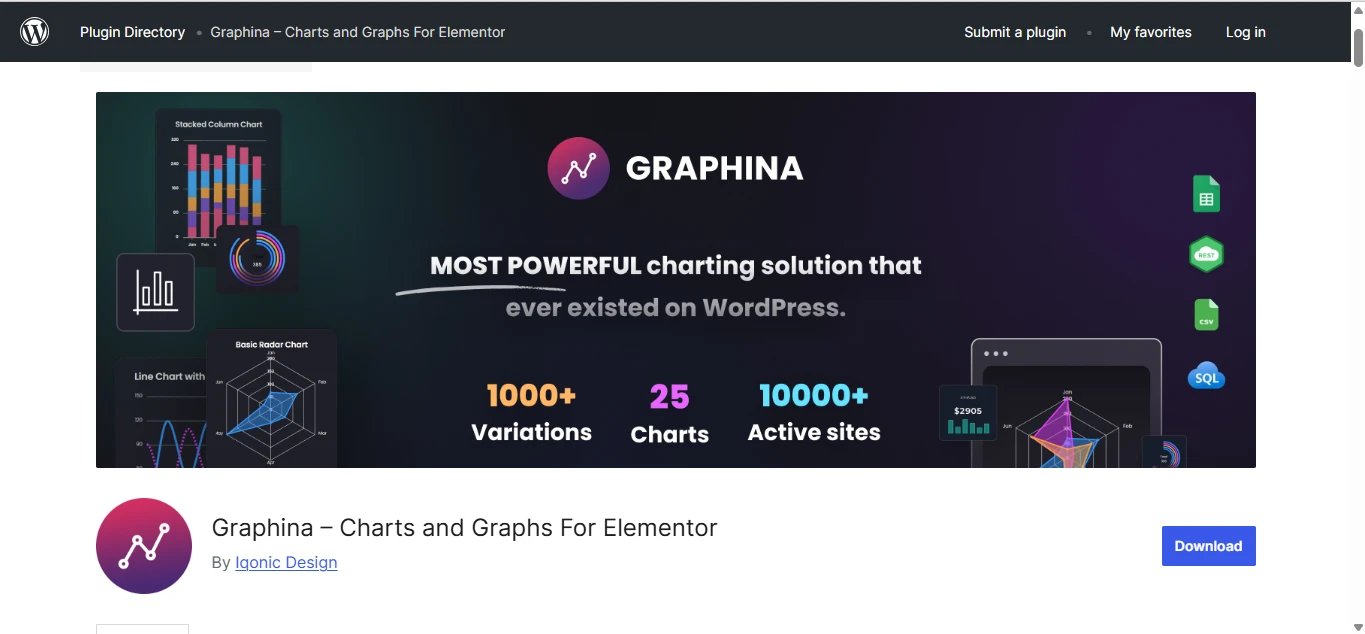
It features different chart types such as line, area, column, nested column, pie, donut, radar, radial, scatter, bubble, heatmap, candlestick, timeline, and mixed charts. It is ideal for users who need complex charts. The chart widgets are built mainly on ApexCharts, with Google Visualization, D3, and jQuery DataTables covering the rest. You can create charts for business reports or even analytics dashboards.
You can either opt for the free or the pro version of this WordPress Elementor plugin. It lets you customize based on color, labels, tooltips, animations, gradients, etc.
- Chart types supported: line, area, column, nested column, pie, donut, radar, radial, scatter, bubble, heatmap, candlestick, timeline, and mixed charts.
- Standout controls: Dynamic data integrations, ApexCharts library, animations, responsive layouts.
- Pricing tier: Free core plugin; Pro unlocks advanced dynamic data sources.
- Best for: Agencies, dashboard builders, and websites that require live or frequently updated data.
4. ElementsKit Chart Widget
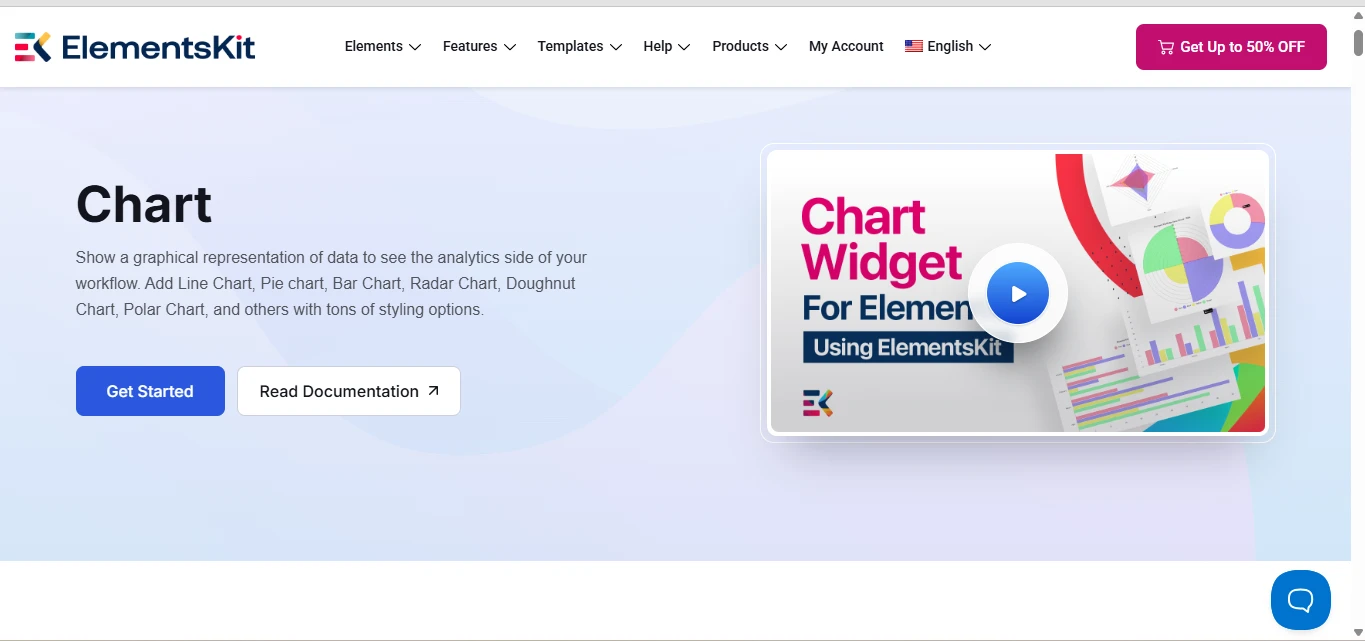
ElementsKit also features a chart widget that can be used on Elementor. You can create charts for different purposes such as educational websites, portfolios, research pages, marketing content, and informative visualizations.
It supports various chart styles such as vertical bar, horizontal bar, line, radar, doughnut, pie, and polar area charts. Therefore, you can present different types of information in the most suitable visualization format.
One can configure it using colors, legends, labels, datasets, and responsive sizing to match your site’s branding. It provides enough functionality for websites that display manually entered data.
- Chart types supported: Vertical bar, horizontal bar, line, radar, doughnut, pie, polar area.
- Standout controls: Dataset customization, responsive layouts, Elementor-native editing, visual styling controls.
- Pricing tier: Premium (included in ElementsKit Pro). A separate Pie Chart widget ships free, but it is a percentage indicator rather than a data chart.
- Best for: Sites already running ElementsKit Pro that need charts without adding a second plugin.
5. JetElements Charts
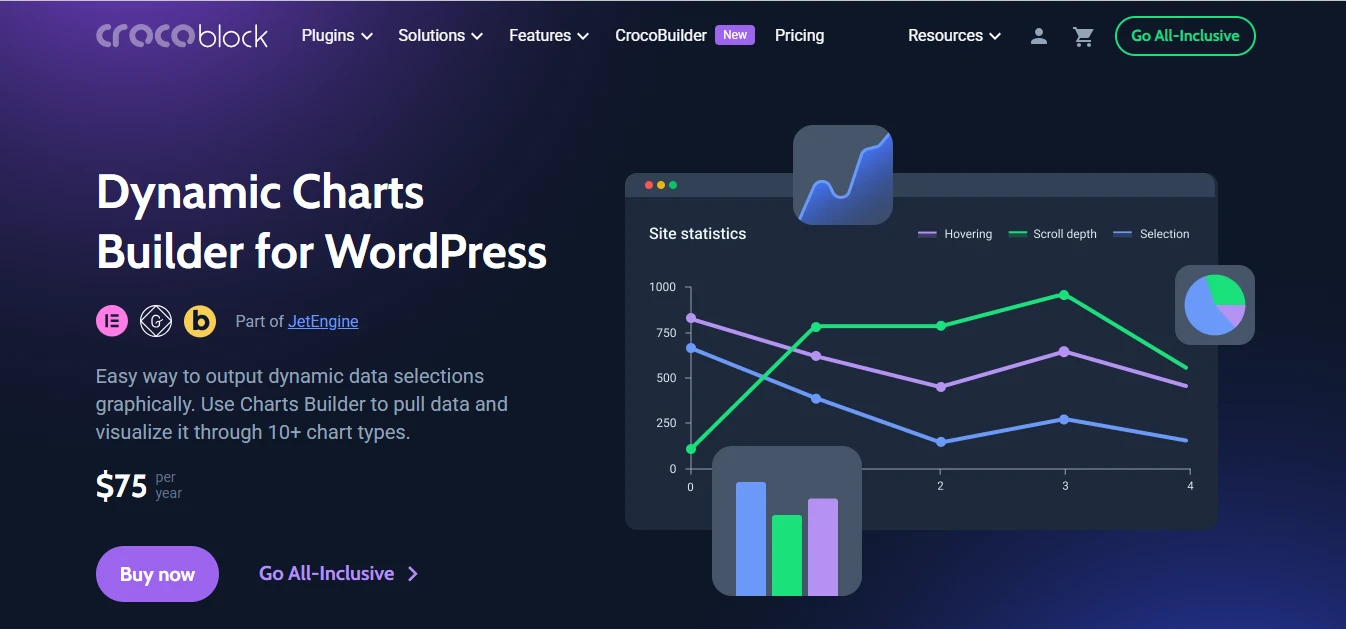
JetElements provides a reliable chart widget for Elementor users. It supports different chart formats like pie, doughnut, bar, and line charts, which makes it suitable for reporting and comparison tasks. You can style it using color, typography, legends, labels, and animations.
JetElements can be combined with JetEngine to enable query-driven charts that display dynamic information pulled from custom post types, custom fields, WooCommerce data, and even database content.
This makes it a fit for directory websites, membership platforms, real estate listings, and similar projects where the underlying data changes without anyone opening the page in Elementor.
- Chart types supported: Pie, Doughnut, Bar, Line.
- Standout controls: JetEngine integration for dynamic data, responsive charts, Elementor styling options.
- Pricing tier: Premium.
- Best for: Dynamic websites built with Crocoblock and JetEngine that require automatically updating charts.
6. PowerPack Addons for Elementor
The PowerPack elements include an advanced charts widget that is ideal for users who need a broader selection of chart types without a dedicated analytics plugin. It supports various visualizations such as line, vertical, horizontal, pie, doughnut, radar, polar area, and bubble charts.
The widget integrates directly with Elementor, so you can build charts without writing code. The various customization options include multiple datasets, color controls, legends, tooltips, axis labels, etc. For the chart widget, you can enter data by hand or import it from a CSV file.
- Chart types supported: Line, Vertical Bar, Horizontal Bar, Pie, Doughnut, Radar, Polar Area, Bubble.
- Standout controls: Chart.js rendering, CSV import, multiple datasets, 20+ animation easing options.
- Pricing tier: Free (included in PowerPack Lite).
- Best for: Sites that need a wide range of chart types without paying for a premium add-on.
7. Premium Addons for Elementor
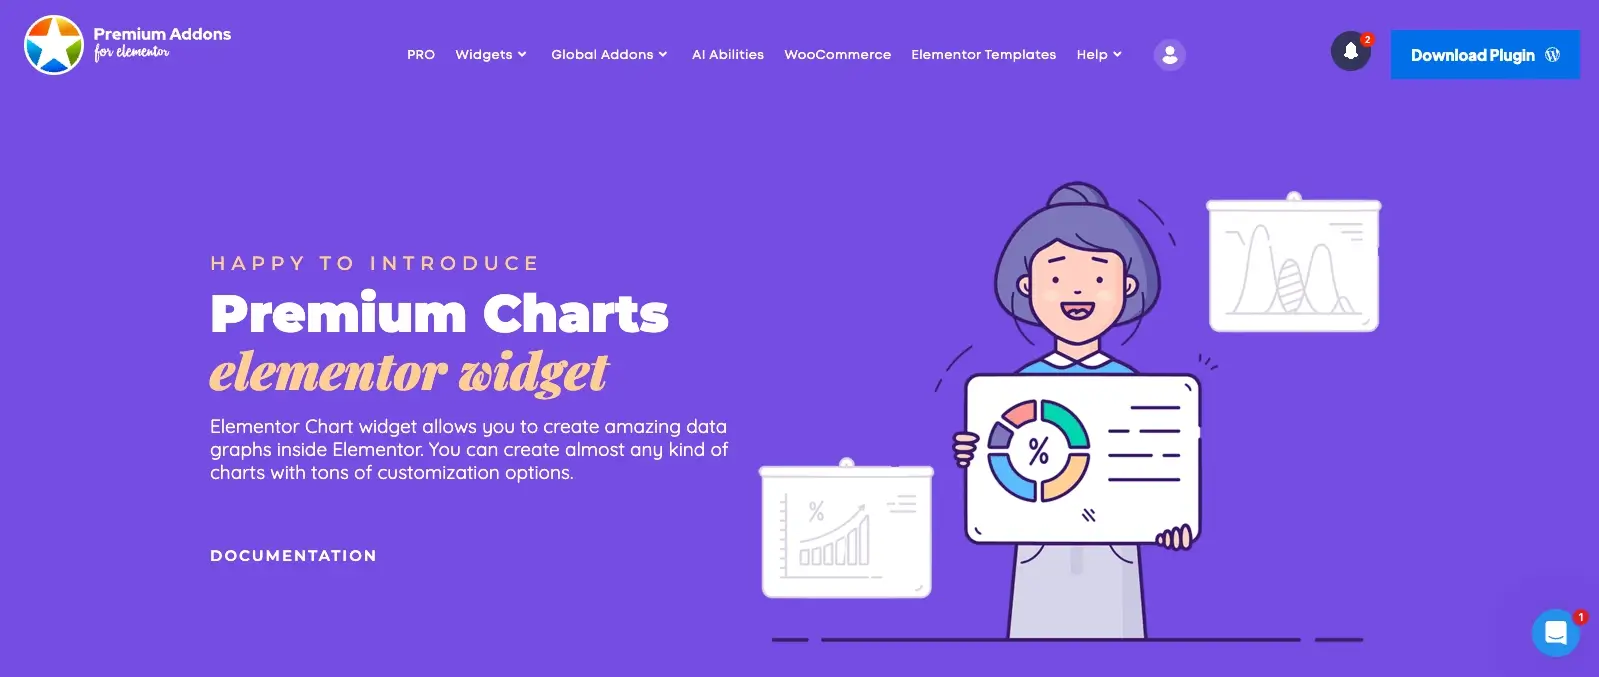
Premium Addons for Elementor also features a widget you can use to create charts. You will be able to display data without relying on third-party services. It offers different chart styles like line, bar, horizontal bar, pie, doughnut, polar area, and radar charts.
Additionally, the widget offers customization features for color, border, typography, legends, grid lines, axis labels, animations, different datasets, etc.
You do not have to key in the data manually. The widget reads from a CSV file, either uploaded to your Media Library or pulled from a remote URL, so a chart updates when you edit the source file. It works for reports, survey results, financial comparison, and website analytics.
- Chart types supported: Line, Bar, Horizontal Bar, Pie, Doughnut, Polar Area, Radar.
- Standout controls: CSV and remote file import, linear or logarithmic Y-axis, clickable dataset URLs, multiple datasets, animation and legend controls.
- Pricing tier: Premium.
- Best for: Designers and marketers creating reports and dashboards where the data lives in a spreadsheet.
8. Element Pack (bdthemes)
Element Pack offers a dedicated chart widget that allows you to visualize data through different formats.
The supported chart formats include line, bar, pie, doughnut, radar, polar area, and bubble charts. You can use the charts to create sales reports, educational statistics, survey summaries, etc. You can customize based on datasets, color, legends, labels, axes, borders, animations, etc.
- Chart types supported: Line, Bar, Pie, Doughnut, Radar, Polar Area, Bubble.
- Standout controls: Multiple datasets, responsive layouts, color and typography customization.
- Pricing tier: Premium.
- Best for: Elementor users who already use Element Pack and want integrated chart functionality.
9. Happy Addons
Happy Addons includes a collection of chart widgets that you can use for data visualization. It offers different chart variations like bar, line, pie, doughnut, polar area, and radar charts. Therefore, you can use the charts for reports, survey results, performance metrics, and simple dashboards.
The available controls cover datasets, labels, legend, colors, border, and responsive display. Data is entered manually. Only the bar chart widget is available in the free version. The rest require Happy Addons Pro.
- Chart types supported: Bar, Line, Pie, Doughnut, Polar Area, Radar.
- Standout controls: X and Y axis line toggles, legend positioning, tooltip styling, per-dataset colors.
- Pricing tier: Mixed. The bar chart widget is free; line, pie, doughnut, polar area, and radar charts are in Happy Addons Pro.
- Best for: Bar charts on the free version, or sites already running Happy Addons Pro that need the full range.
10. Charts and Graphs for Elementor by Redlettuce
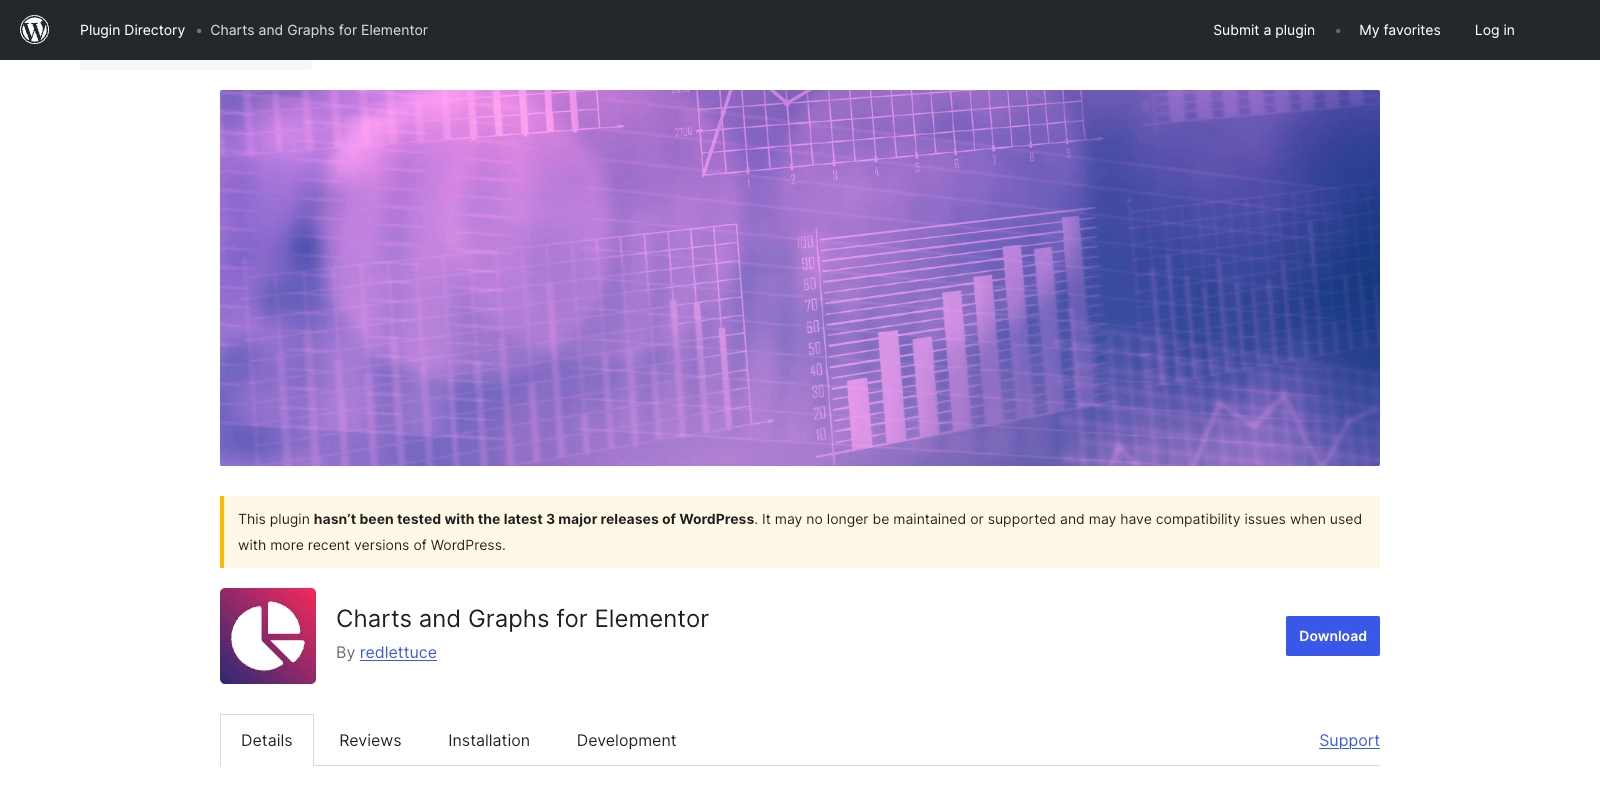
Not to be confused with Graphina, which is listed on WordPress.org under a similar name. This is a separate, smaller plugin.
The plugin is available through WordPress.org. It offers six essential chart types that include line, bar, horizontal bar, pie, doughnut, and polar area charts, which cover most reporting and comparison tasks.
The plugin is designed for users who don’t need an extensive Elementor add-on suite but still want charts inside the page builder.
Data is entered manually, and customization options can be done for the color, labels, legends, and responsive sizing. It is a reasonable option for personal websites, blogs, and small business sites.
At the time of writing, the WordPress.org listing shows the plugin as untested with the three most recent WordPress releases, so check it on staging before using it on a client site.
- Chart types supported: Line, Bar, Horizontal Bar, Pie, Doughnut, Polar Area.
- Standout controls: Six chart types, responsive sizing, straightforward configuration.
- Pricing tier: Free.
- Best for: Website owners seeking a dedicated chart plugin without installing a large Elementor add-on collection.
Elementor Chart Widgets Compared
| Widget | Chart Types | Free Version | Dynamic Data |
| WPMozo Pie Chart | Pie | Yes | No |
| WPMozo Bar Chart | Vertical Bar | Yes | No |
| Graphina | 14+ (Line, Area, Column, Nested Column, Pie, Donut, Radar, Radial, Scatter, Bubble, Heatmap, Candlestick, Timeline, Mixed) | Yes | Yes (Pro: CSV, Google Sheets, Database, APIs) |
| ElementsKit | Vertical Bar, Horizontal Bar, Line, Radar, Doughnut, Pie, Polar Area | No (Premium) | No |
| JetElements | Pie, Doughnut, Bar, Line | No (Premium) | Yes (with JetEngine) |
| PowerPack Elements | Line, Vertical Bar, Horizontal Bar, Pie, Doughnut, Radar, Polar Area, Bubble | Yes | Yes (CSV) |
| Premium Addons | Line, Bar, Horizontal Bar, Pie, Doughnut, Radar, Polar Area | No (Premium) | Yes (CSV, Google Sheets) |
| Element Pack | Line, Bar, Pie, Doughnut, Radar, Polar Area, Bubble | No (Premium) | No |
| Happy Addons | Bar, Line, Pie, Doughnut, Polar Area, Radar | Partial (bar chart only) | No |
| Charts and Graphs for Elementor | Line, Bar, Horizontal Bar, Pie, Doughnut, Polar Area | Yes | No |
How to Add a Pie Chart in Elementor With WPMozo (Step by Step Tutorial)
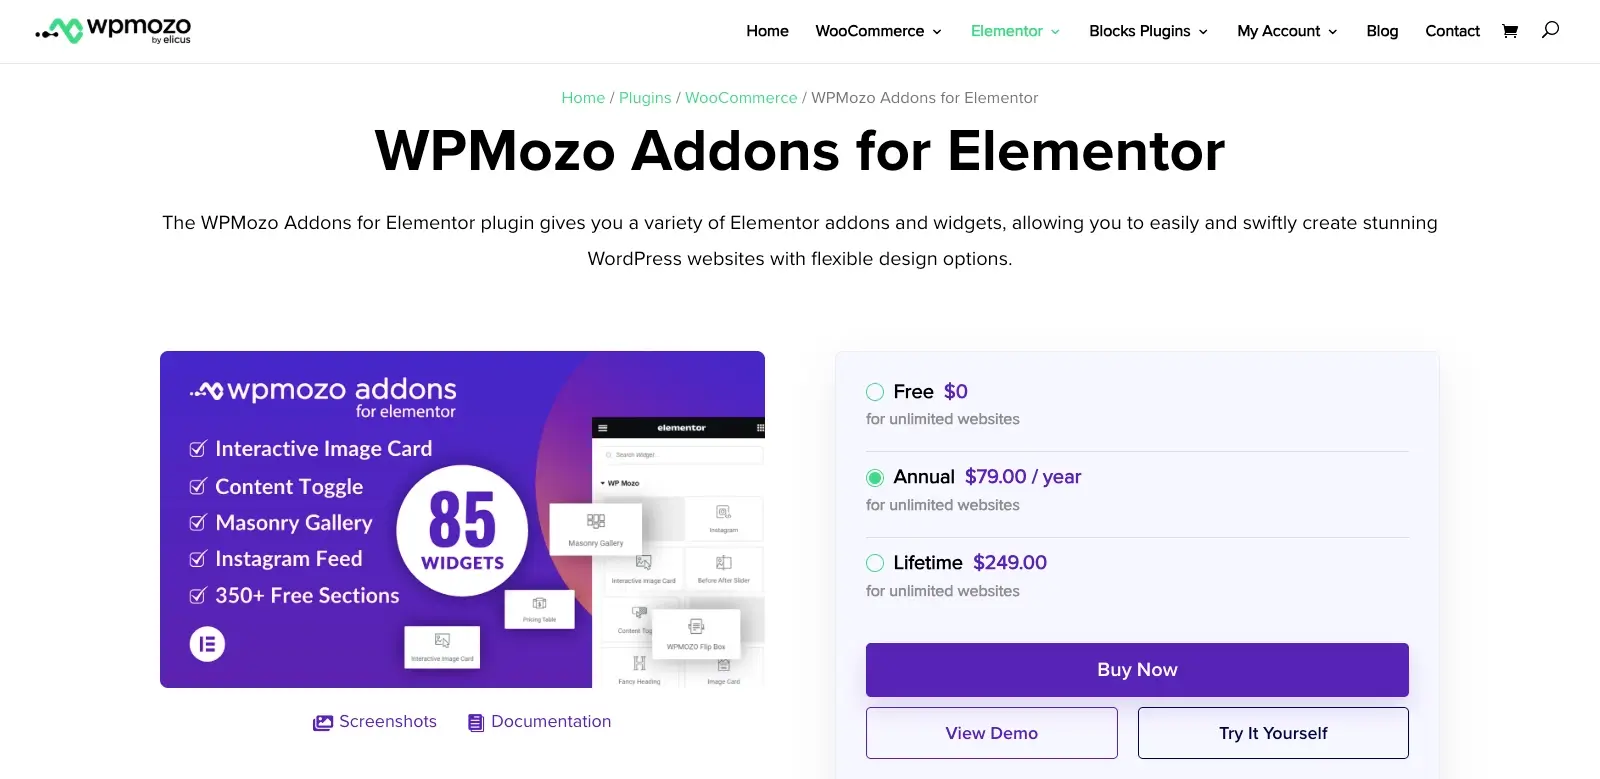
Step 1: Download and Install the WPMozo Addons for Elementor
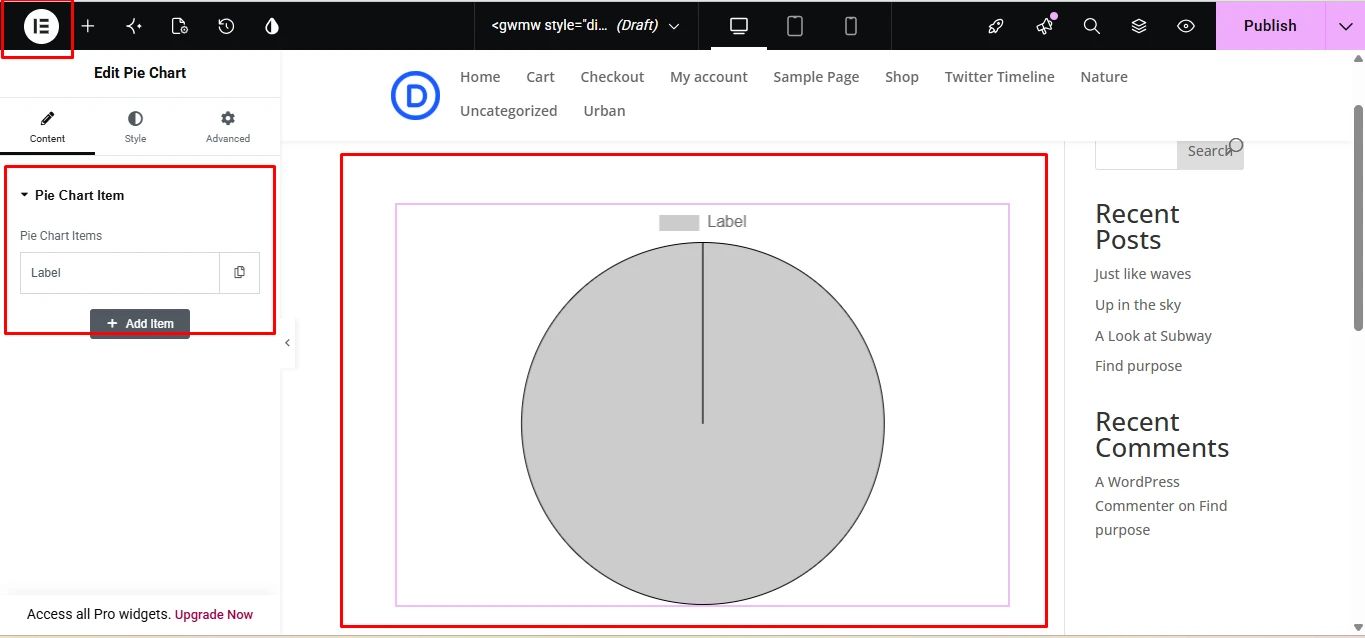
First, download and install the WPMozo Addons for Elementor on WordPress, then you can start using them on the platform. The plugin will appear as a menu item on the left sidebar.
Step 2: Check Whether the Pie Chart Widget Option Is Enabled
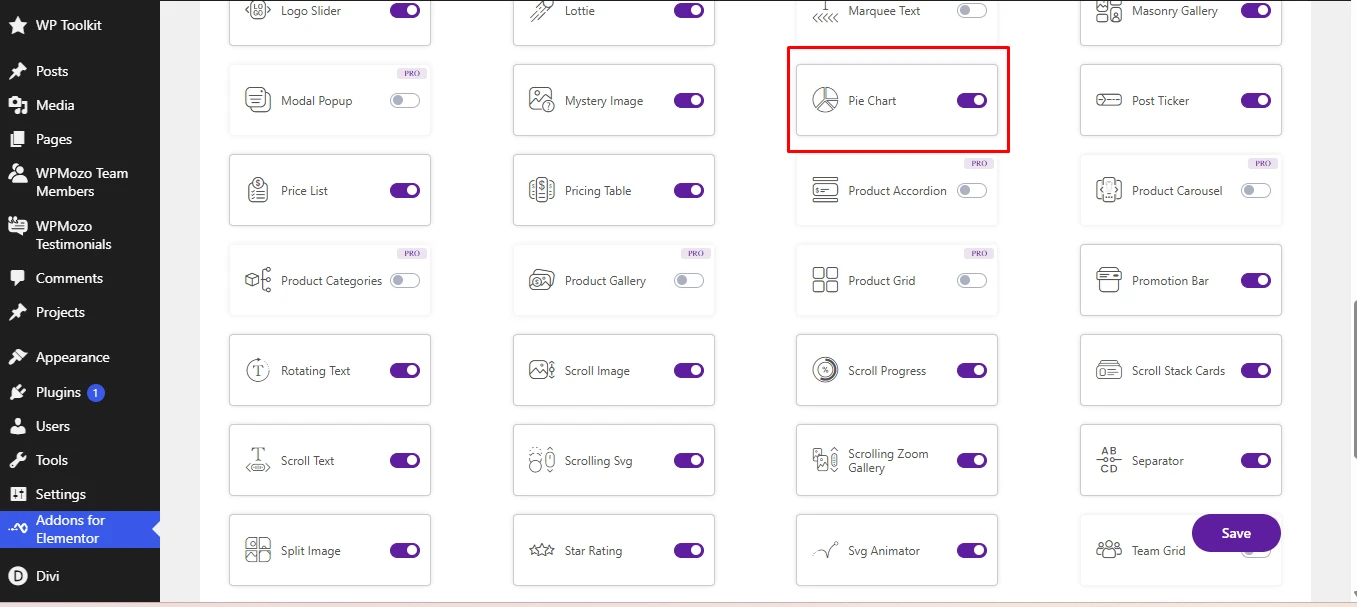
With successful plugin installation, it is key to check whether the pie chart option is enabled. Therefore, click on Addons for Elementor on the left sidebar menu to check whether the Pie chart widget option is enabled.
Step 3: Create a Page
Proceed to create a page where you will feature your pie chart. Therefore, click on Page > Add Page > Choose to edit with Elementor.
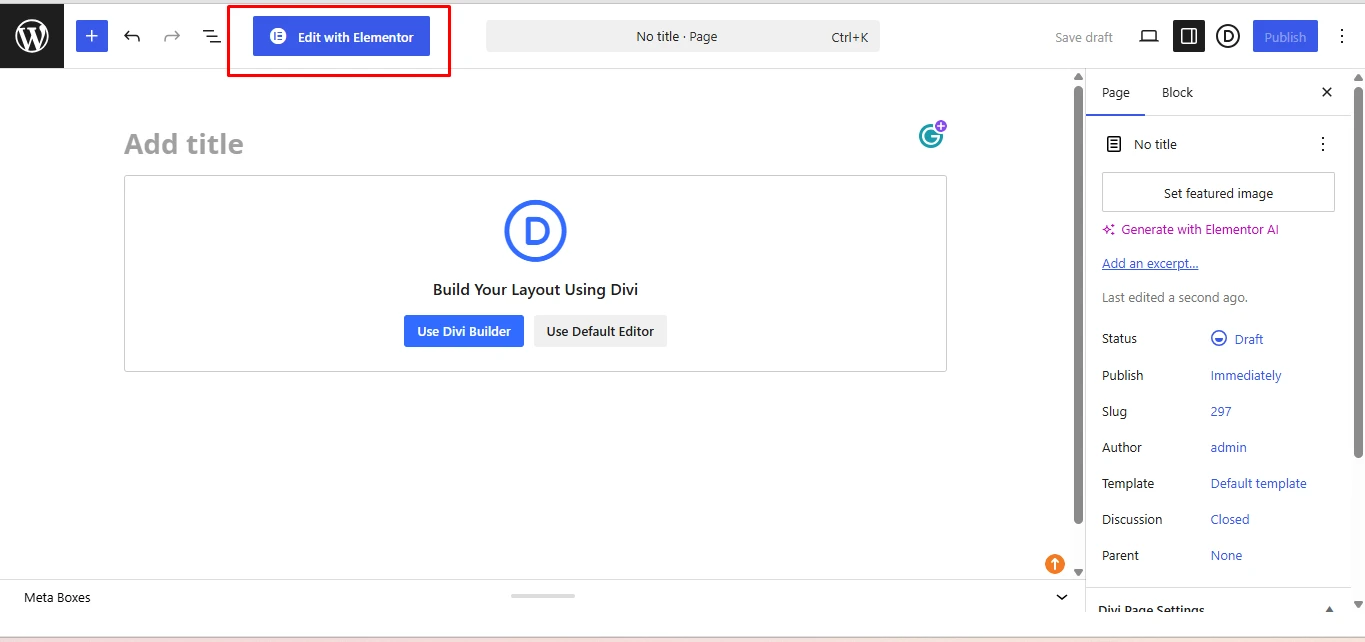
Step 4: Add the Pie Chart Widget
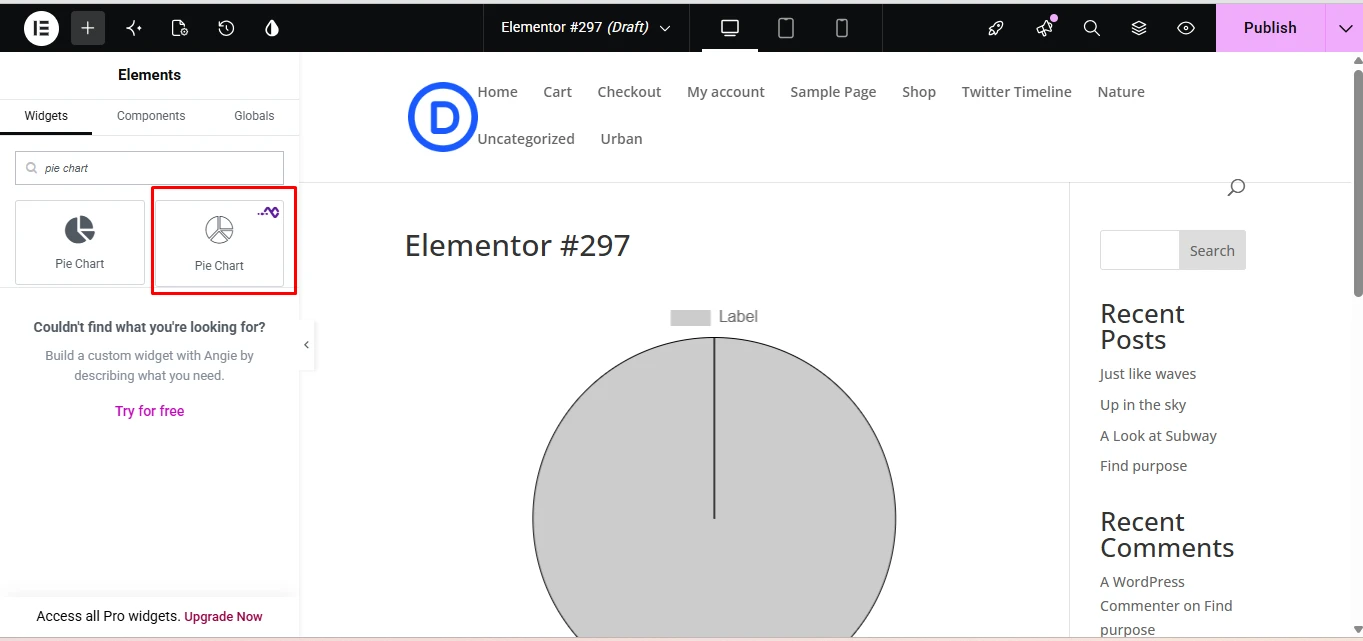
In the search bar, check for Pie Chart. Remember to choose the Pie Chart widget with the WPMozo logo. It will be displayed on the page.
Step 5: Modify the Menu Items
On the left menu bar, under the Content tab, proceed to provide a name for the different pie slices and choose different color variations to differentiate, based on what you are showcasing.
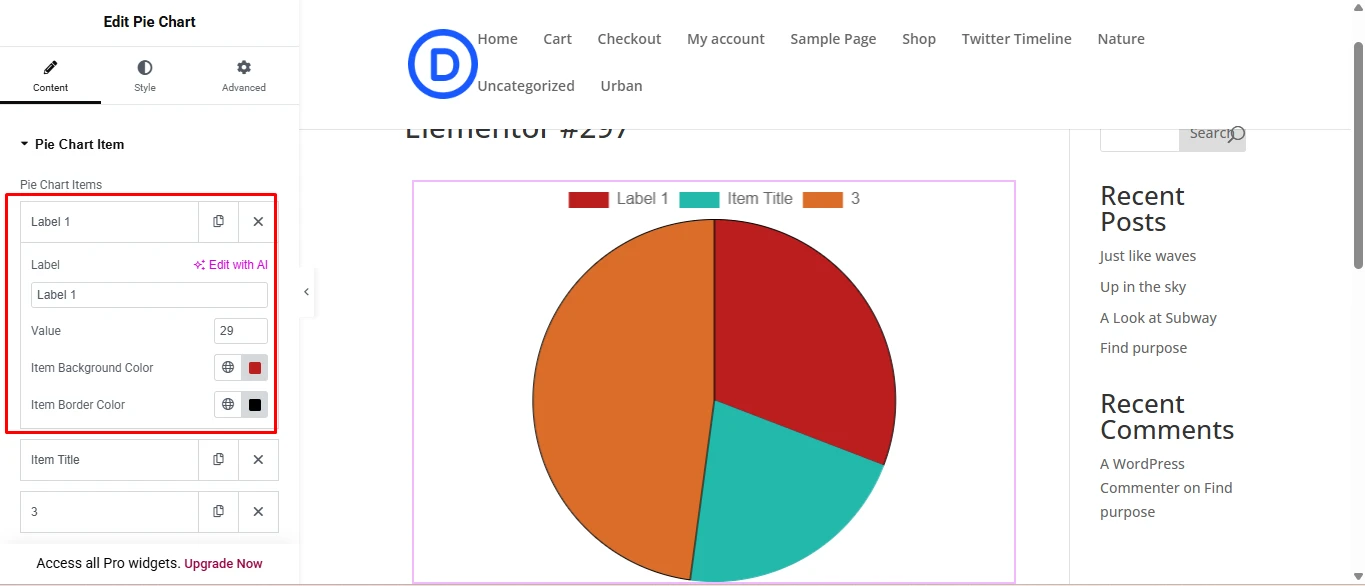
Step 6: Modify the Style
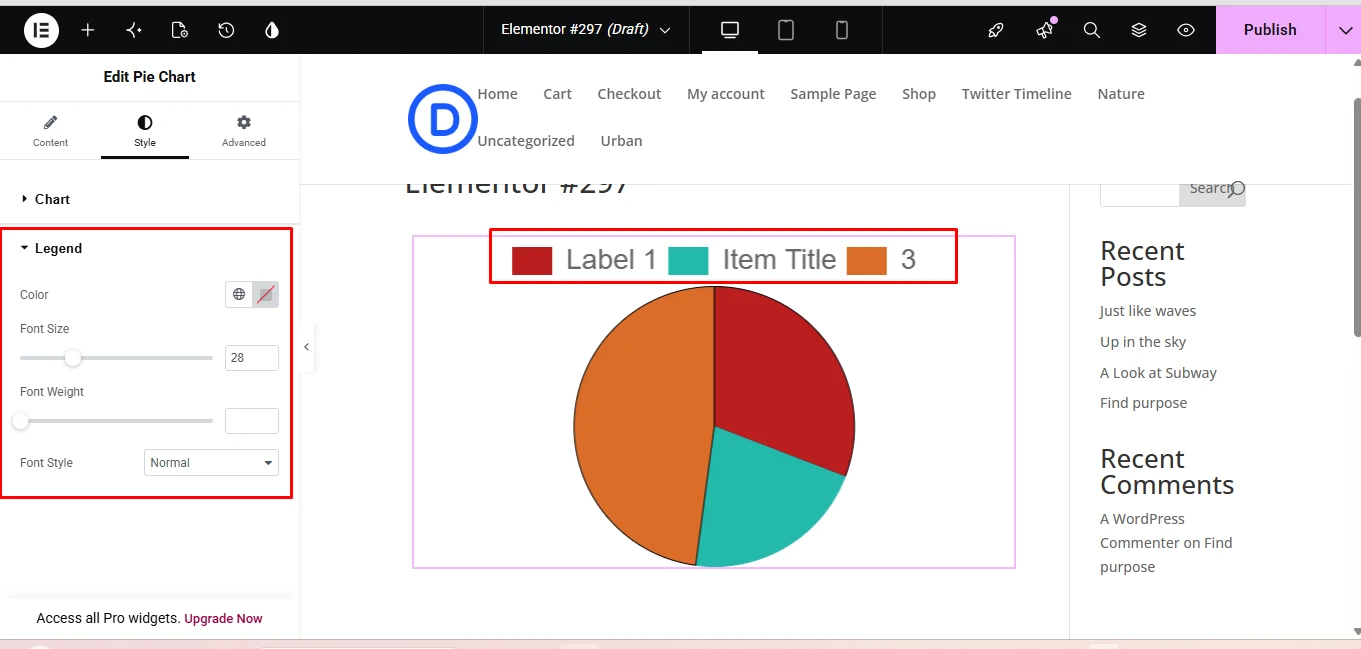
Next, proceed to modify the style. Click on the Style tab, which will allow you to modify as needed. Select the Chart setting, and from there you can modify the chart style.
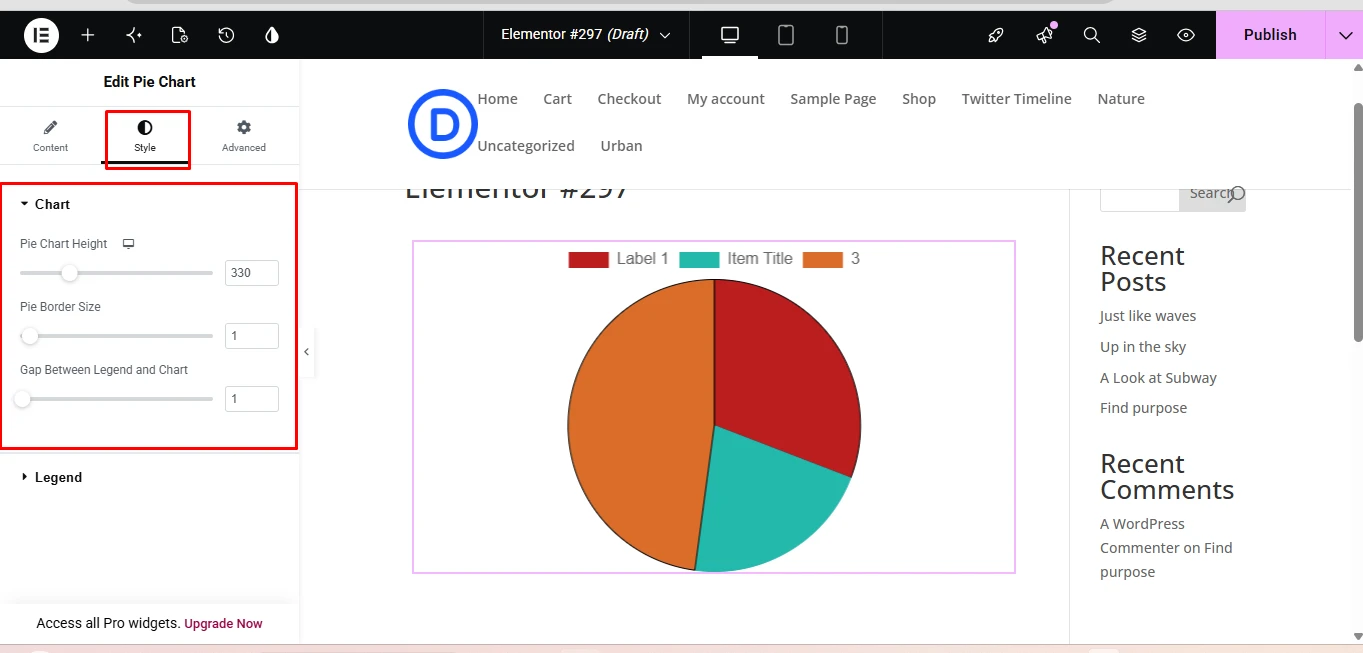
You can modify the pie chart height, pie border size, and gap between legend and chart. Additionally, with the Legend option, you can change the font size, font weight, and font style.
Creating a bar chart follows the same method; the only difference will be the overall outlook. Instead of searching for a pie chart, you will search for a bar chart.
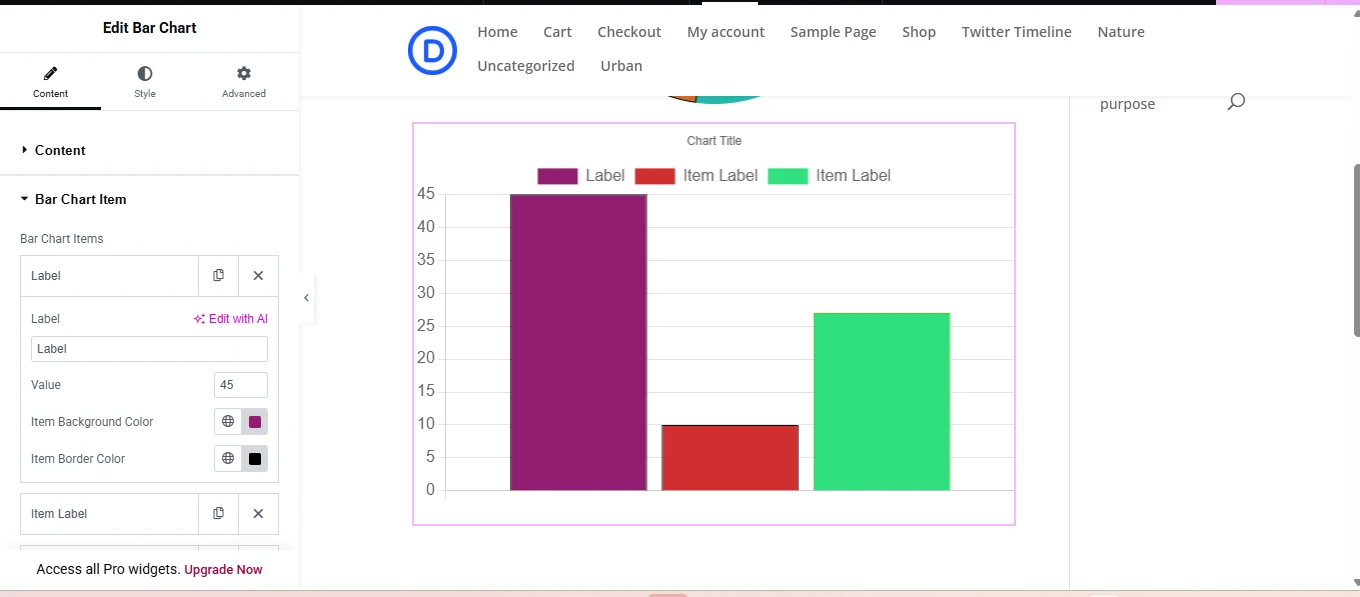
You can add as many items as you need, plus also change the chart title and color variations based on your data. You can get more information from the Pie Chart documentation and the Bar Chart documentation.
Which Chart Widget Should You Pick?
The best Elementor chart widget mostly depends on how you want to manage your data. If you want to create static charts for landing pages, pricing comparisons, case studies, reports, or survey summaries, a chart widget that allows you to manually enter data would be best. For instance, WPMozo Addons for Elementor is a practical option, and you also get a broader collection of Elementor widgets in one plugin.
However, if you need your charts to update automatically from WordPress posts, custom fields, APIs, or Google Sheets, consider solutions such as Graphina Pro or JetEngine that offer dynamic data integrations. Premium Addons is worth a look if your data already lives in a CSV or a Google Sheet.
On the other hand, if page performance is a priority, choose a single chart plugin that meets all the requirements instead of installing multiple addons that each load with their own charting library.
Frequently Asked Questions
Elementor includes widgets such as progress bar and counter, but doesn’t have a native widget for creating pie, bar, line, or other data charts. That’s why the functionality is added through some Elementor widgets from third-party sources.
Yes, you just need to install an Elementor chart add-on, drag the chart widget onto your page, and enter your labels, values, and styling options from the content and style tabs.
Yes, the WPMozo Addons for Elementor list both its pie chart and bar chart widgets in the free version of the plugin, while additional widgets and features are available in the complete add-on. You can view the available widgets on the WPMozo Addons for Elementor product page.
Chart widgets load a JavaScript charting library such as Chart.js or ApexCharts to render visualizations. To minimize unnecessary assets, it is better to use one chart plugin that meets your needs rather than installing multiple chart addons. Here’s how to fix a slow Elementor editor.
Yes, however, support generally depends on the plugin. For instance, Graphina Pro offers integrations with dynamic sources such as Google Sheets, while JetEngine can generate charts from WordPress content, custom fields, and dynamic data.
Conclusion
Choosing the right Elementor chart widget depends on where your data lives and how often it changes. For manually entered pie and bar charts inside a broader Elementor toolkit, WPMozo Addons for Elementor covers both in its free version.




0 Comments